ClearAll["`*"]
SetDirectory[NotebookDirectory[]];
m1 = ParametricPlot[{-v Cos[u], v Sin[u]}, {u, 0, 2 Pi}, {v, 1.5,
    1.7}, Mesh -> None, Frame -> False,
   ColorFunction ->
    Function[{u, v}, ColorData["LightTemperatureMap"][v]],
   BoundaryStyle -> None, Axes -> False, Background -> White,
   PlotLegends ->
    Placed[BarLegend[Automatic, LegendMarkerSize -> {20, 200},
      LegendLabel -> "\[CapitalDelta](\[Theta])",
      LabelStyle ->
       Directive[Black, FontSize -> 24,
        FontFamily -> "Times New Roman"]], {After, Center}]];
axes = Graphics[{Arrow[{{{0, 0}, {0, 2}}, {{0, 0}, {2, 0}}}], {Dashed,
      Arrow[{{0, 0}, {Sqrt[2], Sqrt[2]}}]},
    Text[Style["\[Theta]", FontFamily -> "Times New Roman", 24], {0.8,
       0.4}], Text[
     Style["\!\(\*SubscriptBox[\(k\), \(x\)]\)",
      FontFamily -> "Times New Roman", 24], {2.3, 0}],
    Text[Style["\!\(\*SubscriptBox[\(k\), \(y\)]\)",
      FontFamily -> "Times New Roman", 24], {0, 2.3}],
    Text[Style["\!\(\*FractionBox[\(\[Pi]\), \(2\)]\)",
      FontFamily -> "Times New Roman", 24], {-0.3, 1.4}],
    Text[Style["-\!\(\*FractionBox[\(\[Pi]\), \(2\)]\)",
      FontFamily -> "Times New Roman", 24], {-0., -1.2}]}];
ang = ParametricPlot[0.6 {Sin[x], Cos[x]}, {x, Pi/4, Pi/2},
   PlotStyle -> Directive[Dashed, Thickness[0.008], Red]];
p1 = Show[m1, axes, ang, PlotRange -> All]
Export["mass2.png", p1, ImageResolution -> 200];
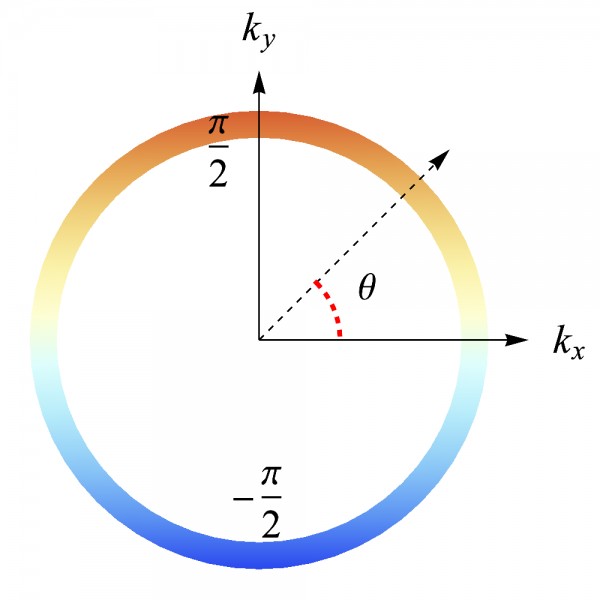
为什么这里的图例始终不显示,该怎么解决?
这个问题被我自己解决了--------------------
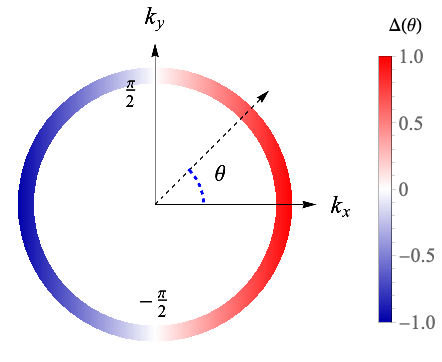
ClearAll["`*"]
SetDirectory[NotebookDirectory[]];
bar = Module[{dx, zColor}, dx = 0.1;
   zColor = Flatten[Table[i/10, {i, 0, 10, dx}], 1];
   BarLegend[{Blend[{Darker@Blue, White, Red}, #] & /@ zColor, {-1,
      1}}, LegendMarkerSize -> 300,
    LegendLabel -> "\[CapitalDelta](\[Theta])",
    LabelStyle -> {FontSize -> 20,
      FontFamily -> "Times New Roman"}]];
m1 = ParametricPlot[{-v Cos[u], v Sin[u]}, {u, 0, 2 Pi}, {v, 1.5,
    1.7}, Mesh -> None, Frame -> False,
   ColorFunction -> (Blend[{Darker@Blue, White, Red}, #1] &),
   BoundaryStyle -> None, Axes -> False, Background -> White,
   PlotLegends -> bar];
axes = Graphics[{Arrow[{{{0, 0}, {0, 2}}, {{0, 0}, {2, 0}}}], {Dashed,
      Arrow[{{0, 0}, {Sqrt[2], Sqrt[2]}}]},
    Text[Style["\[Theta]", FontFamily -> "Times New Roman", 24], {0.8,
       0.4}], Text[
     Style["\!\(\*SubscriptBox[\(k\), \(x\)]\)",
      FontFamily -> "Times New Roman", 24], {2.3, 0}],
    Text[Style["\!\(\*SubscriptBox[\(k\), \(y\)]\)",
      FontFamily -> "Times New Roman", 24], {0, 2.3}],
    Text[Style["\!\(\*FractionBox[\(\[Pi]\), \(2\)]\)",
      FontFamily -> "Times New Roman", 24], {-0.3, 1.4}],
    Text[Style["-\!\(\*FractionBox[\(\[Pi]\), \(2\)]\)",
      FontFamily -> "Times New Roman", 24], {-0., -1.2}]}];
ang = ParametricPlot[0.6 {Sin[x], Cos[x]}, {x, Pi/4, Pi/2},
   PlotStyle -> Directive[Dashed, Thickness[0.008], Blue]];
p1 = Show[m1, axes, ang, PlotRange -> All]