本问题由以下网友翻译整理:雾霭,瓦屋青衣
通过下面的代码,我们可以用MMA画出XKCD样式的各式图表。实现的方法是通过首先改变MMA原图中的图形(例如线,字体等),然后对整个图像做变形。
The code below attempts to apply the XKCD style to a variety of plots and charts. The idea is to first apply cartoon-like styles to the graphics objects (thick lines, silly font etc), and then to apply a distortion using image processing.
通过使用最终的程序xkcdConvert ,我们可以很简单的画出xkcd式的基本图表。通过改变xkcdStyle 中的参数,我们可以改变输出的字体和大小。因为对整体图像做变形的时候同样会变形其中的字体,而使用了Comic Sans字体。本程序中没有使用Humor Sans的原因是为了防止出现不好辨认的情况。xkcdLabel 的功能是用来在图中方便的添加标签。xkcdLabel[{str,{x1,y1},{xo,yo}}各参数为:str代表要添加的标注,{x1,y1} 为添加的标注线的位置,{xo,yo} 为标注的位置。下面是几个基本的例子:
The final function is xkcdConvert which is simply applied to a standard plot or chart.
The font style and size are set by xkcdStyle which can be changed to your preference. I've used the dreaded Comic Sans font, as the text will get distorted along with everything else and I thought that starting with the Humor Sans font might lead to unreadable text.
The function xkcdLabel is provided to allow labelling of plot lines using a little callout. The usage is xkcdLabel[{str,{x1,y1},{xo,yo}] where str is the label (e.g. a string), {x1,y1} is the position of the callout line and {xo,yo} is the offset determining the relative position of the label. The first example demonstrates its usage.
xkcdStyle = {FontFamily -> "Comic Sans MS", 16};

xkcdLabel[{str_, {x1_, y1_}, {xo_, yo_}}] := Module[{x2, y2},
   x2 = x1 + xo; y2 = y1 + yo;
   {Inset[
     Style[str, xkcdStyle], {x2, y2}, {1.2 Sign[x1 - x2],
      Sign[y1 - y2] Boole[x1 == x2]}], Thick,
    BezierCurve[{{0.9 x1 + 0.1 x2, 0.9 y1 + 0.1 y2}, {x1, y2}, {x2, y2}}]}];

xkcdRules = {EdgeForm[ef:Except[None]] :> EdgeForm[Flatten@{ef, Thick, Black}],
   Style[x_, st_] :> Style[x, xkcdStyle],
   Pane[s_String] :> Pane[Style[s, xkcdStyle]],
   {h_Hue, l_Line} :> {Thickness[0.02], White, l, Thick, h, l},
   Grid[{{g_Graphics, s_String}}] :> Grid[{{g, Style[s, xkcdStyle]}}],
   Rule[PlotLabel, lab_] :> Rule[PlotLabel, Style[lab, xkcdStyle]]};

xkcdShow[p_] := Show[p, AxesStyle -> Thick, LabelStyle -> xkcdStyle] /. xkcdRules

xkcdShow[Labeled[p_, rest__]] :=
 Labeled[Show[p, AxesStyle -> Thick, LabelStyle -> xkcdStyle], rest] /. xkcdRules

xkcdDistort[p_] := Module[{r, ix, iy},
   r = ImagePad[Rasterize@p, 10, Padding -> White];
   {ix, iy} =
    Table[RandomImage[{-1, 1}, ImageDimensions@r]~ImageConvolve~
      GaussianMatrix[10], {2}];
   ImagePad[ImageTransformation[r,
     # + 15 {ImageValue[ix, #], ImageValue[iy, #]} &, DataRange -> Full], -5]];

xkcdConvert[x_] := xkcdDistort[xkcdShow[x]]
一些示例:
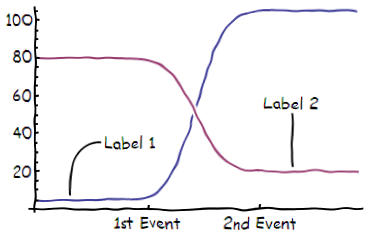
f1[x_] := 5 + 50 (1 + Erf[x - 5]);
f2[x_] := 20 + 30 (1 - Erf[x - 5]);
xkcdConvert[Plot[{f1[x], f2[x]}, {x, 0, 10},
  Epilog ->
   xkcdLabel /@ {{"Label 1", {1, f1[1]}, {1, 30}}, {"Label 2", {8, f2[8]}, {0, 30}}},
  Ticks -> {{{3.5, "1st Event"}, {7, "2nd Event"}}, Automatic}]]
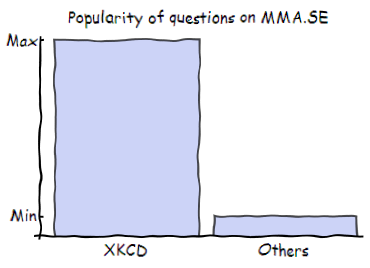
xkcdConvert[BarChart[{10, 1}, ChartLabels -> {"XKCD", "Others"},
  PlotLabel -> "Popularity of questions on MMA.SE",
  Ticks -> {None, {{1, "Min"}, {10, "Max"}}}]]
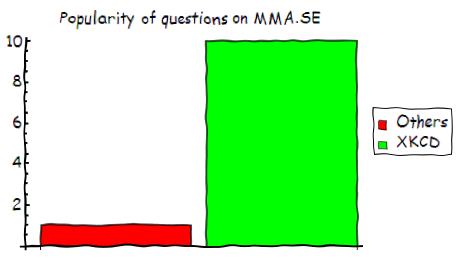
xkcdConvert[BarChart[{1, 10}, ChartLegends -> {"Others", "XKCD"},
  PlotLabel -> "Popularity of questions on MMA.SE",
  ChartStyle -> {Red, Green}]]
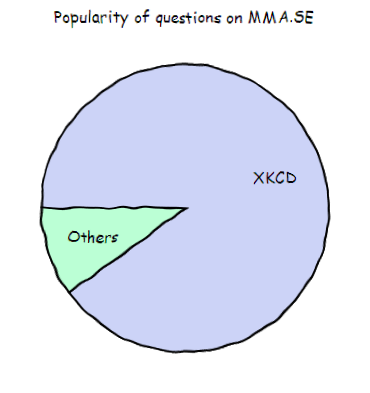
xkcdConvert[PieChart[{9, 1}, ChartLabels -> {"XKCD", "Others"},
  PlotLabel -> "Popularity of questions on MMA.SE"]]
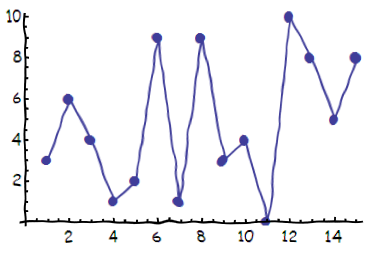
xkcdConvert[
 ListLinePlot[RandomInteger[10, 15], PlotMarkers -> Automatic]]
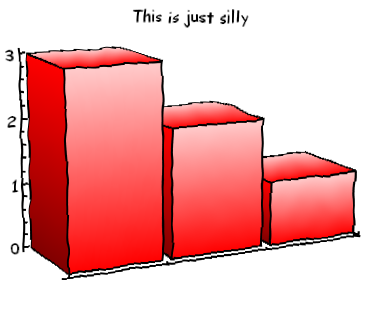
xkcdConvert[BarChart3D[{3, 2, 1}, ChartStyle -> Red, FaceGrids -> None,
  Method -> {"Canvas" -> None}, ViewPoint -> {-2, -4, 1},
  PlotLabel -> "This is just silly"]]
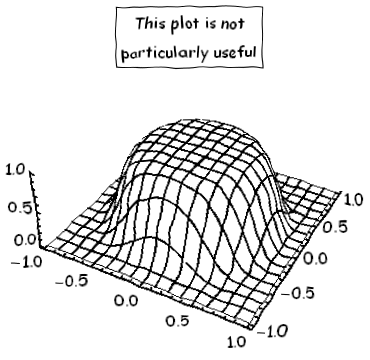
xkcdConvert[
 Plot3D[Exp[-10 (x^2 + y^2)^4], {x, -1, 1}, {y, -1, 1},
  MeshStyle -> Thick,
  Boxed -> False, Lighting -> {{"Ambient", White}},
  PlotLabel -> Framed@"This plot is not\nparticularly useful"]]
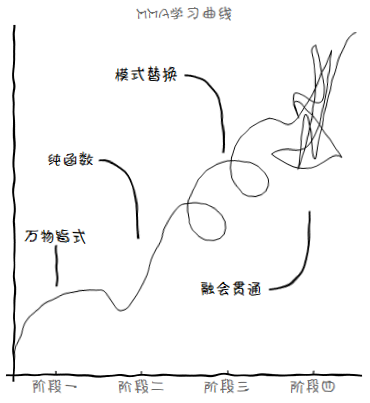
图中使用中文字符时,通常采用“迷你简卡通”字体,这是科学松鼠会和果壳网常用的做法。
比如下图:
Graphics[{BezierCurve@{{0, 0}, {0, 1}, {1, 1}},
   Line[{#,
       Interpolation[{{{1}, 1, 0}, {{1.25}, 0.75, 0}, {{2}, 2,
           0}}][#]} & /@ Range[1, 2, 0.01]],
   ReIm@Exp[I (Pi/2 - #)]/3 + {#, #}/(4 Pi) + {2, 5/3} & /@
     Range[0, 4 Pi, Pi/10] // Line,
   BezierCurve[
    Join[{{3, 3}, {3.2, 3}}, {1, 2} # + {3, 2} & /@
      RandomReal[{0, 1}, {20, 2}], {{3.8, 4}, {4, 4}}]]},
  Epilog ->
   xkcdLabel /@ {{"基本语法", {0.5, 1}, {0, 0.5}}, {"纯函数", {1.5,
       1.5}, {-0.5, 1}}, {"模式替换", {2.5, 2.5}, {-0.5,
       1}}, {"万物皆式", {3.5, 2}, {-0.5, -1}}}, Axes -> True,
  PlotLabel -> "mma学习曲线",
  Ticks -> {MapIndexed[{Last@#2 - 0.5, "阶段" ~~ #1} &,
     ToString /@ {一, 二, 三, 四}], {}}] // xkcdConvert